
Example 4: Agent V2 — Intelligent Data Analysis Agent
Analyze a reproducible sales sample, calculate product units and channel advertising ROI, and inspect downloadable artifacts.
Example 4: Agent V2 — Intelligent Data Analysis Agent
4.1 Use Cases
Agent V2 chooses processing steps from the task and data. This example runs Python in the virtual machine to produce a sales summary and channel revenue chart.
4.2 Preparation
Download sales.csv. The four fictional sales records use one consistent currency unit:
product,channel,units,revenue,ad_cost
A,Search,10,1000,200
B,Search,5,750,150
A,Social,8,800,400
B,Social,12,1800,600
You need application creation permission, a model supporting tool calls, an available virtual-machine service, and model quota. The captured run uses qwen3.8-flash. The execution environment must provide or install Python plotting dependencies. Network access, resource limits, and isolation follow the execution-service configuration.
4.3 Configuration Steps
-
Go to Studio → Agents, click the first New card in the list (or Create your first Agent in the center of the page when the list is empty), select Chat Agent V2, enter
Intelligent Data Analysis Agentin the name box, and click Create to the right of the name box.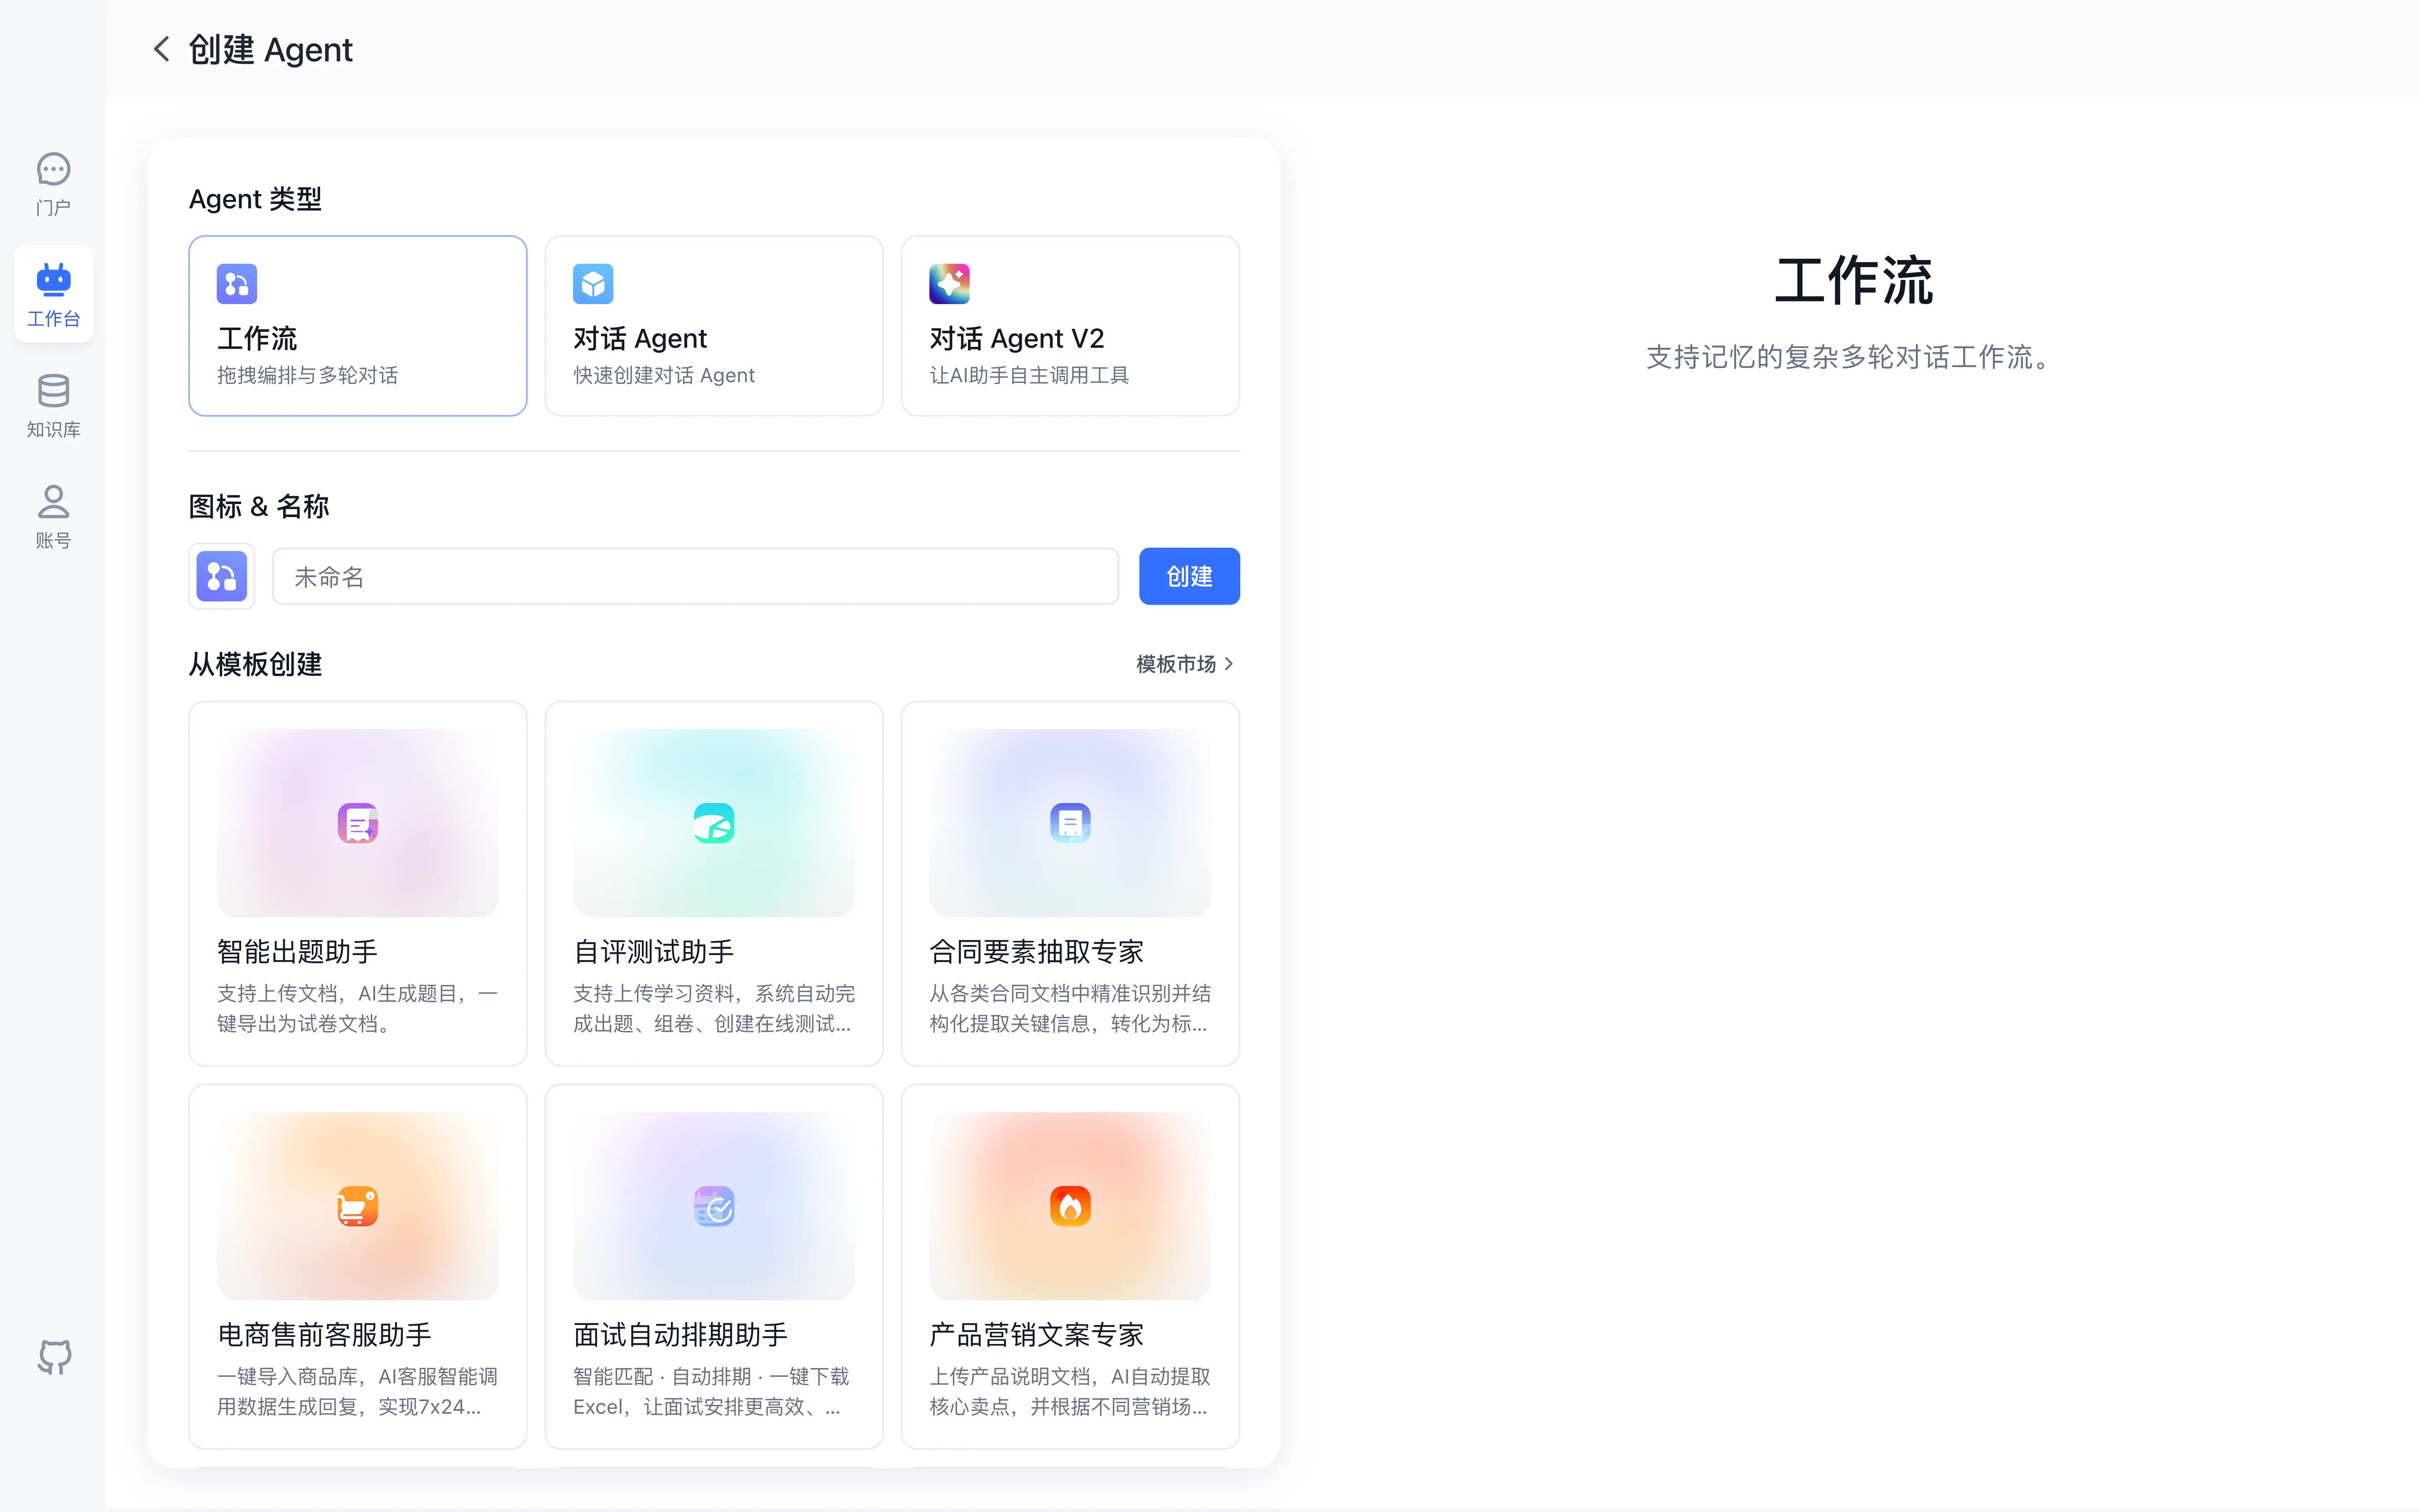
-
Choose a model supporting tool calls and enable Computer. This example uses built-in file and command tools; Skills can remain empty.
-
Enter this prompt:
Use Python in the virtual machine to analyze the uploaded sales CSV. Calculate units by product and revenue, ad_cost, and ROI by channel. ROI = (revenue - ad_cost) / ad_cost. Save channel_summary.csv and a revenue chart as revenue.png. Return download links and concise results. -
Upload
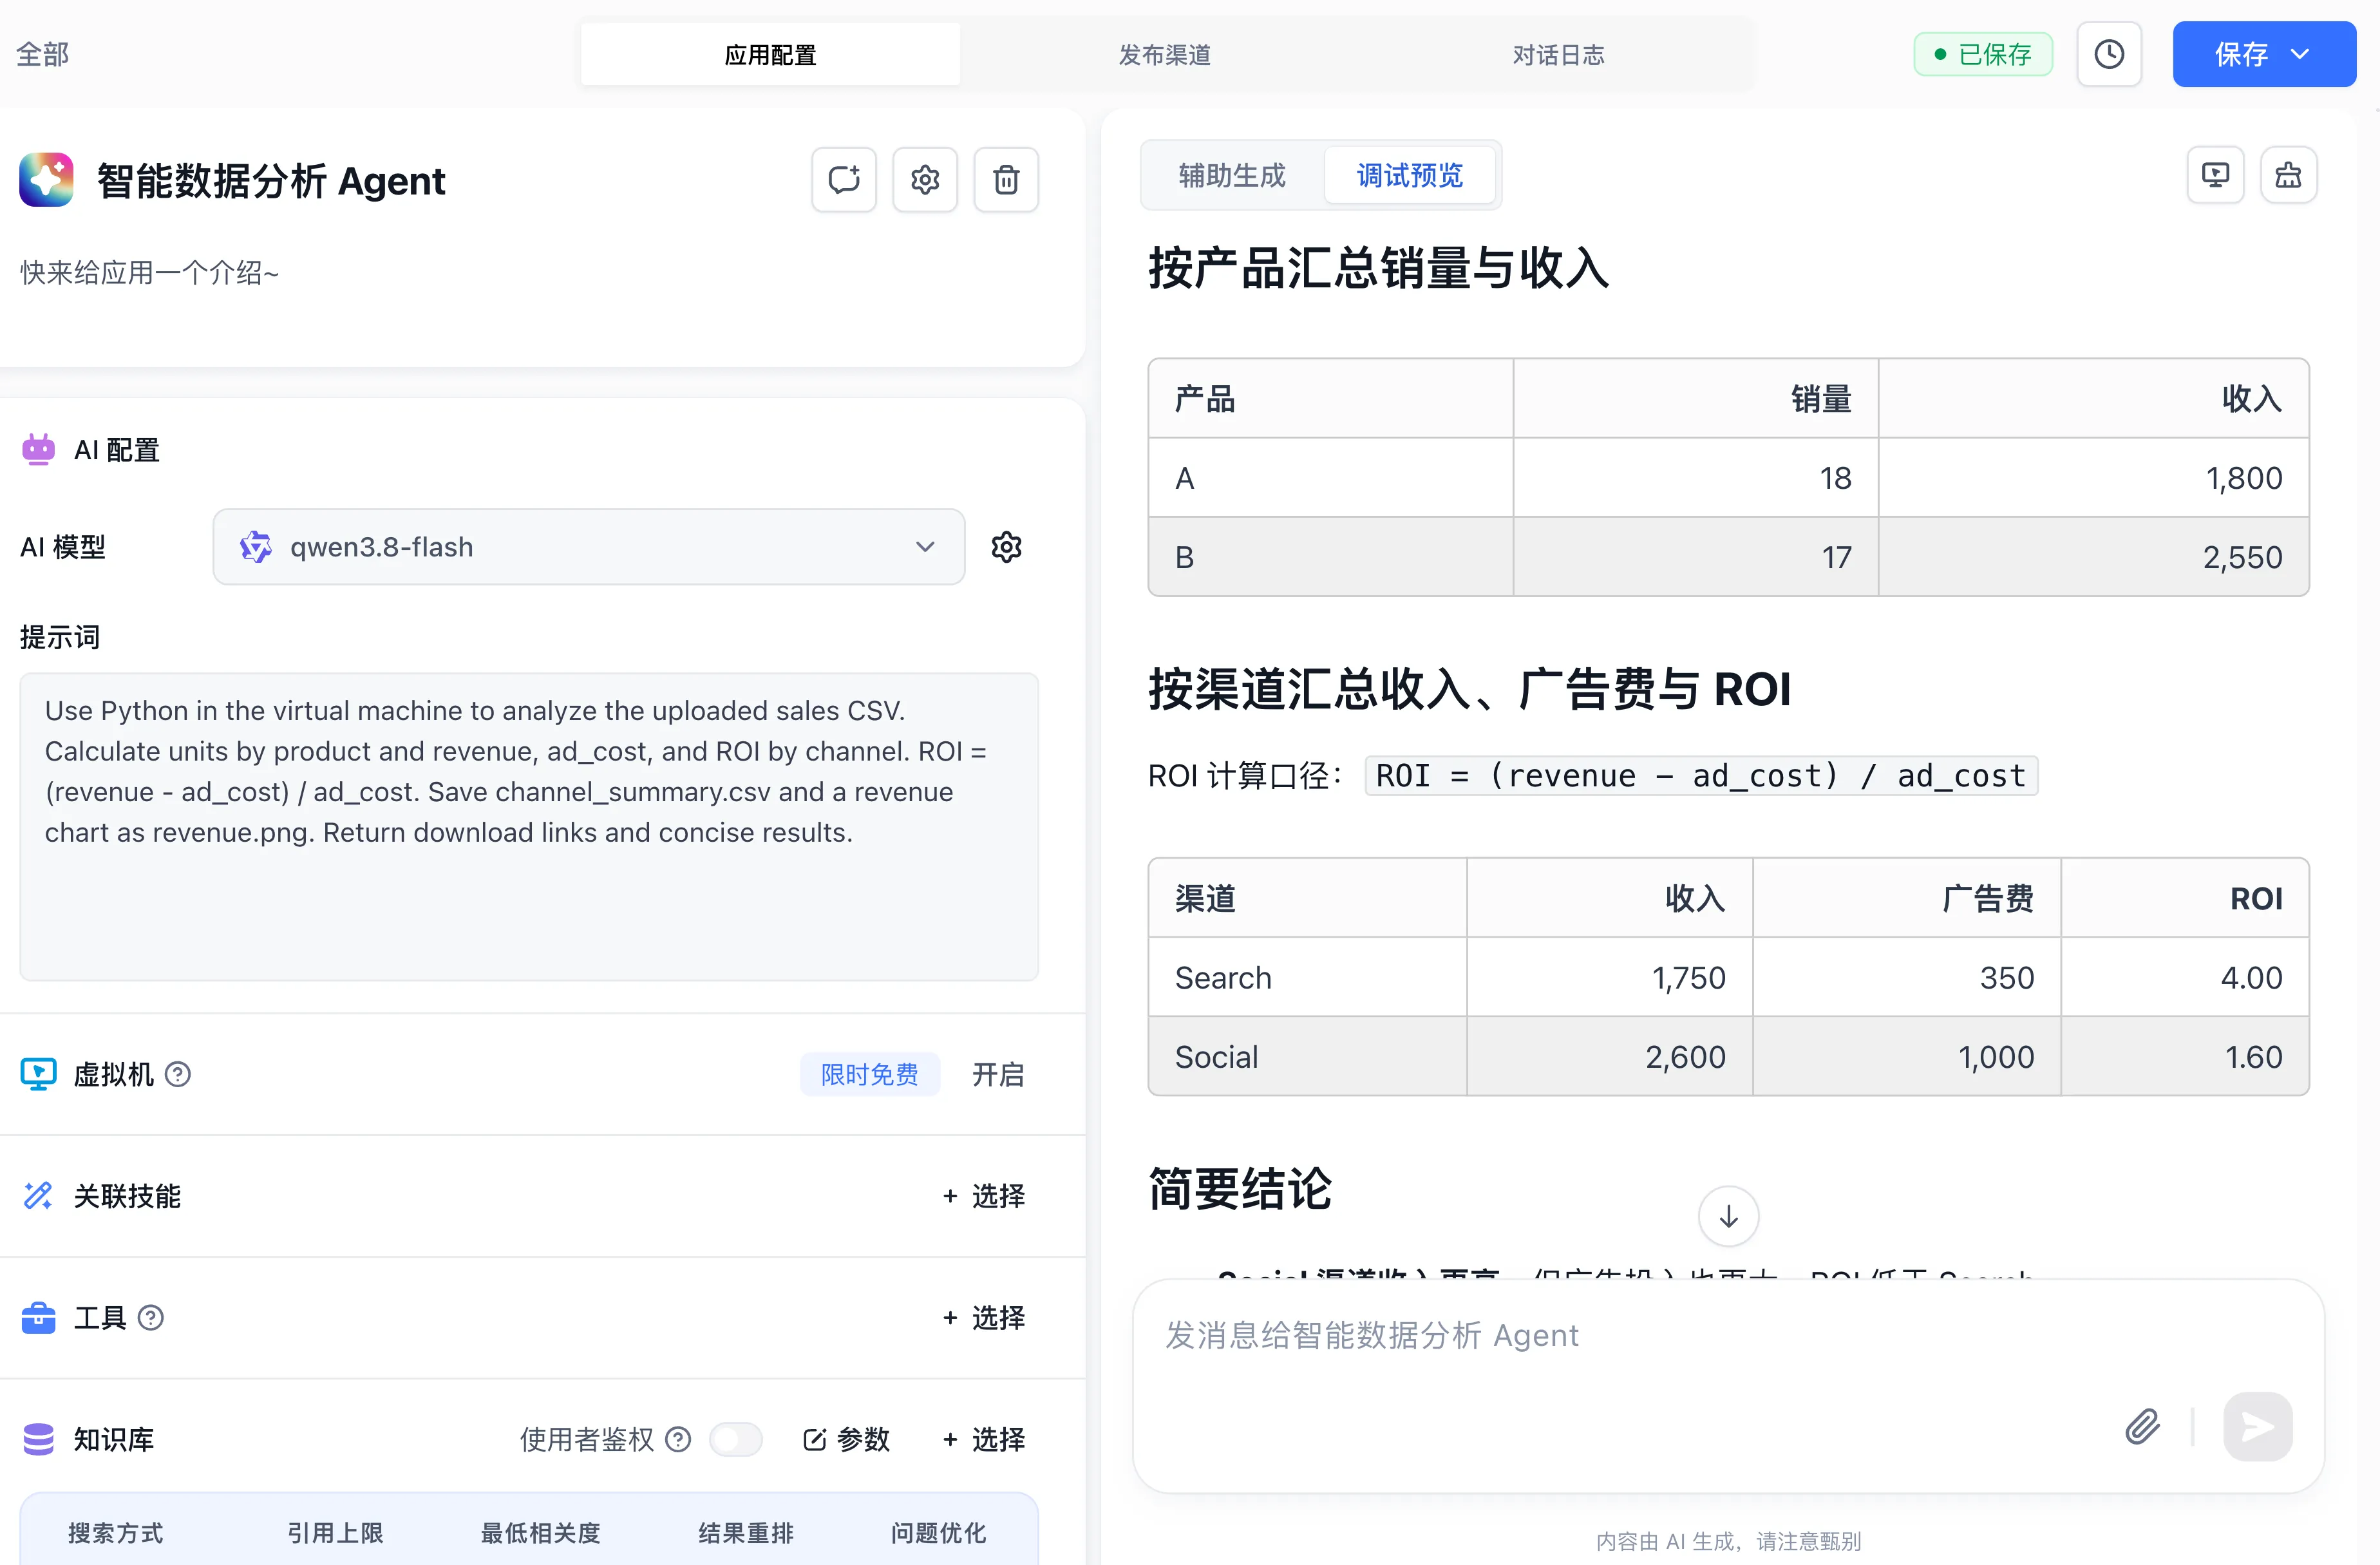
sales.csvin debug preview and wait for completion. Ask: “Analyze the attached file: aggregate units by product and revenue, advertising cost, and advertising ROI by channel. Generate a summary CSV and revenue chart.” -
Expand Processed to inspect file reads, commands, and their results. For missing dependencies, check installation output or configure a startup script.
-
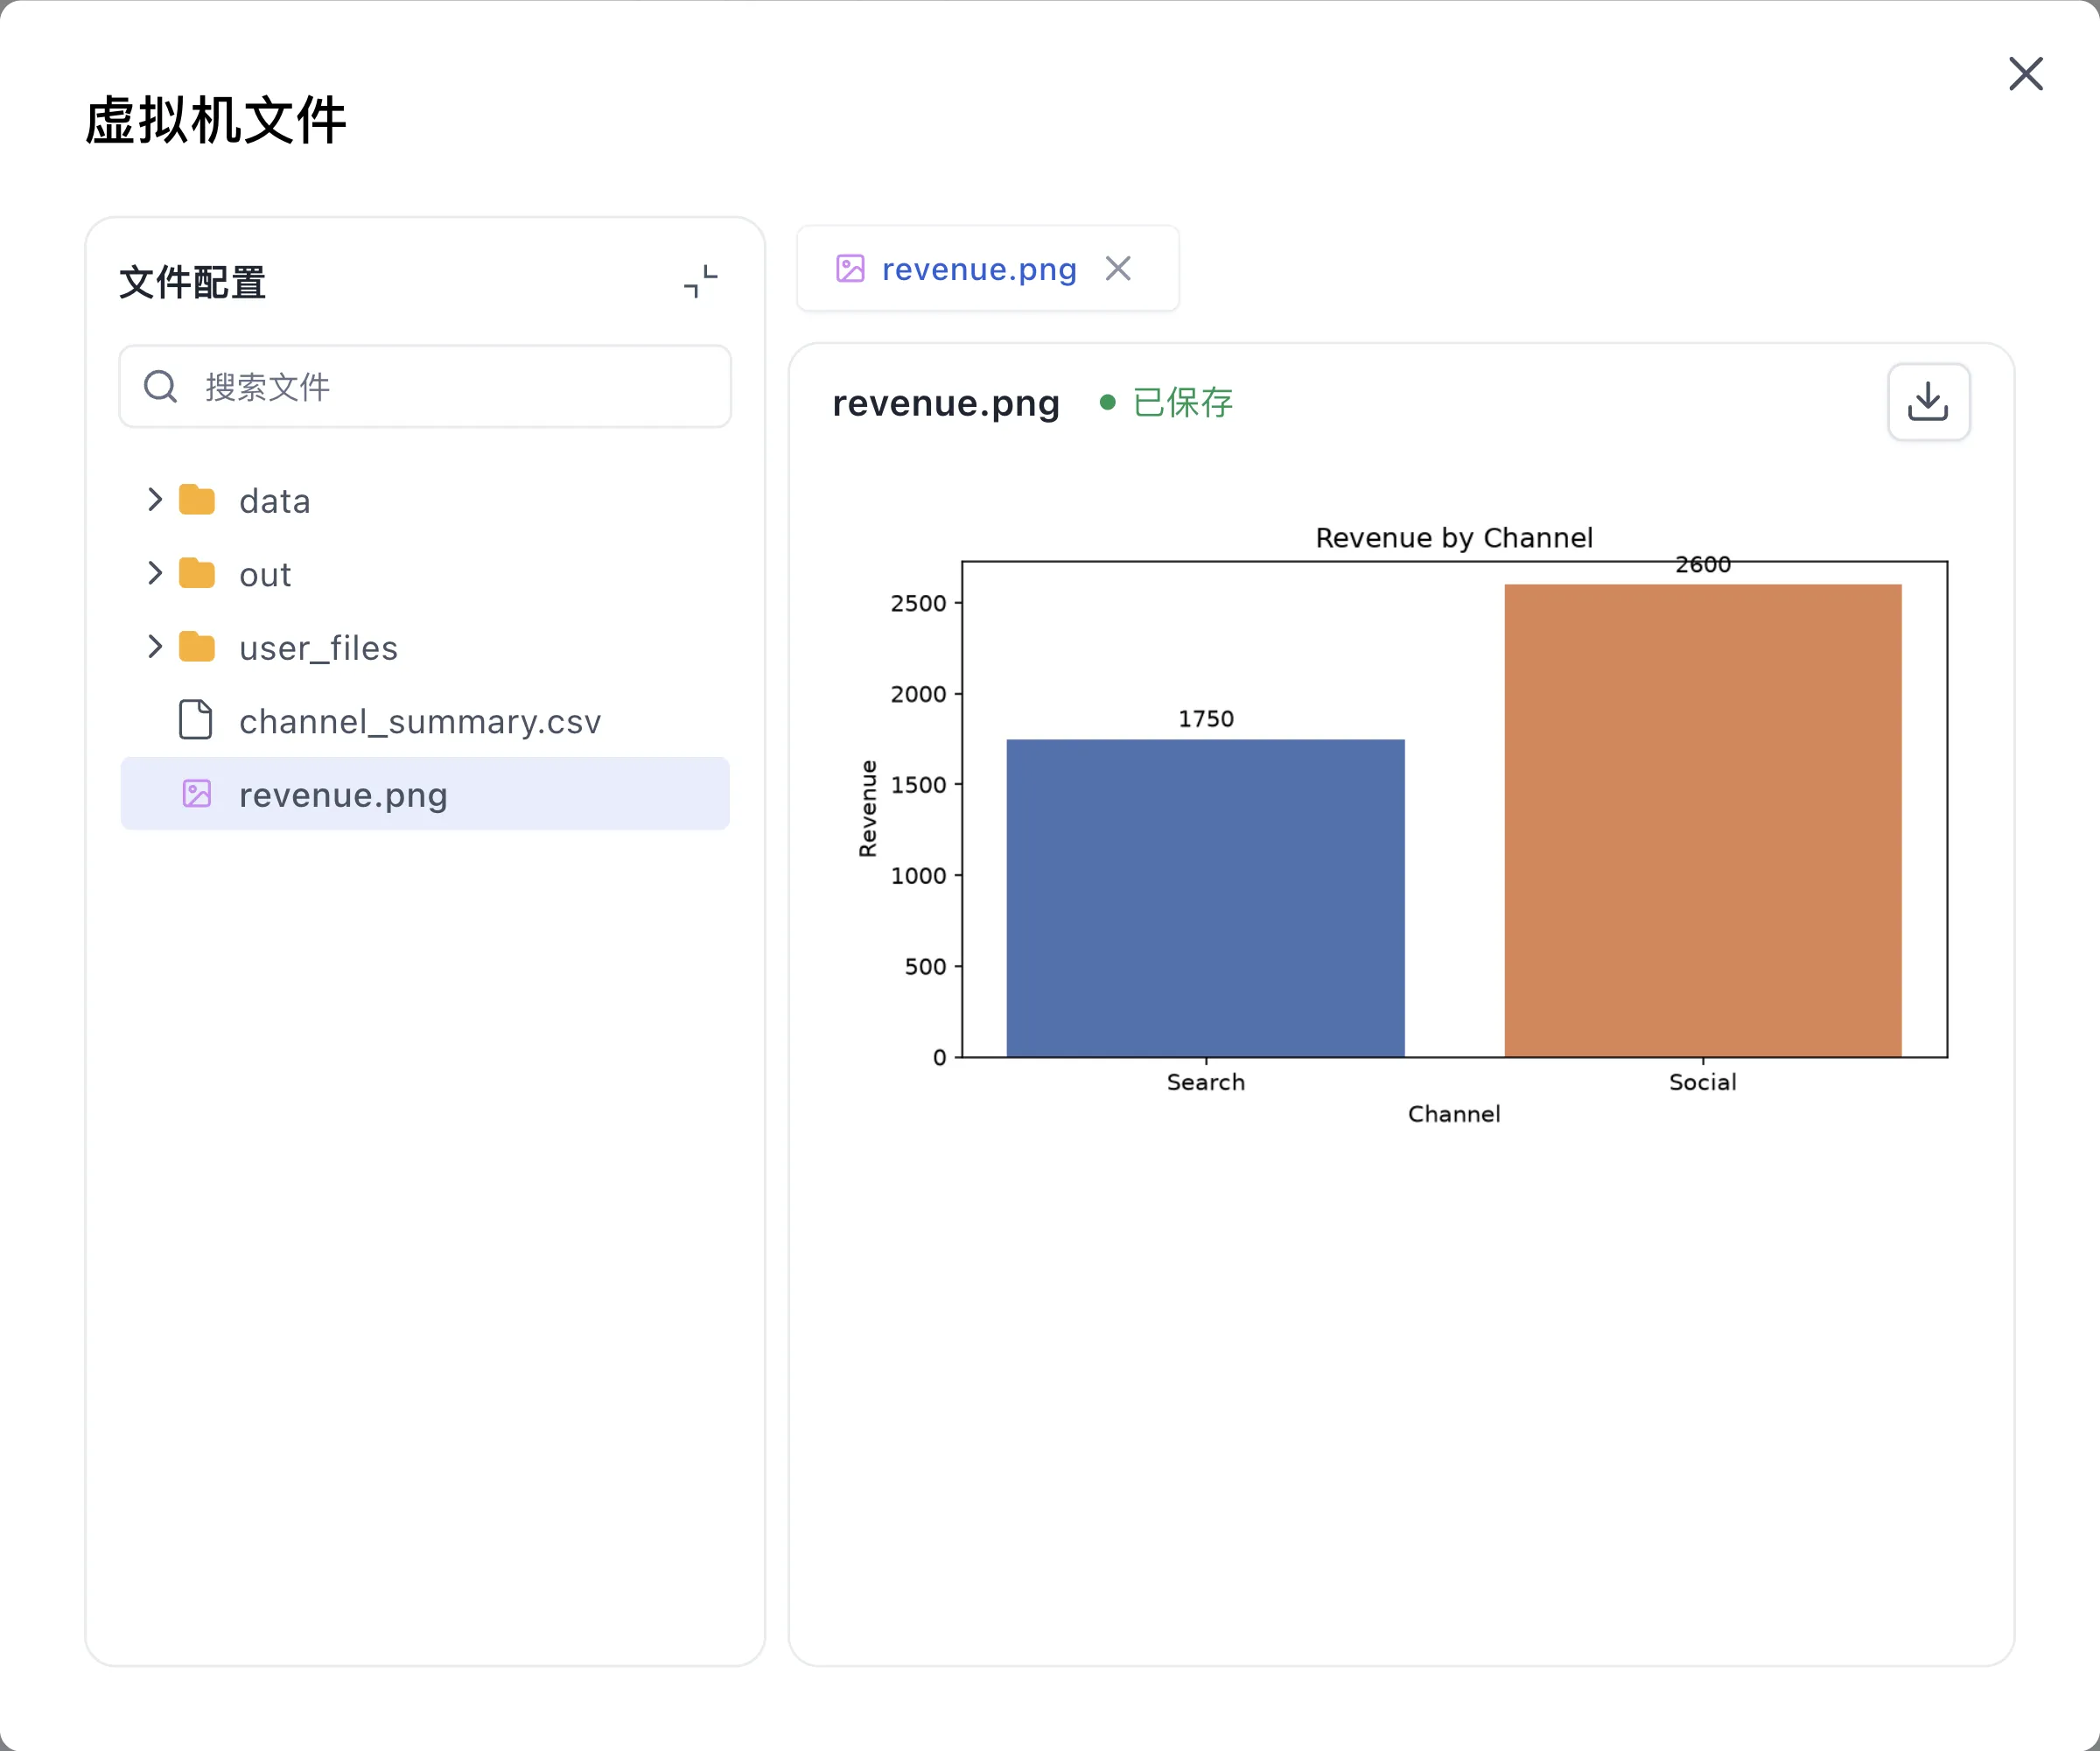
Click the View Sandbox files icon button at the upper right of debug preview. Check
channel_summary.csvandrevenue.png. Preview and download the image in the file panel; use the file link in the answer to download the CSV.
4.4 Verification of Results
| Metric | Expected value |
|---|---|
| Product A units | 18 |
| Product B units | 17 |
| Search: revenue / ad cost / ROI | 1750 / 350 / 4.00 (400%) |
| Social: revenue / ad cost / ROI | 2600 / 1000 / 1.60 (160%) |
ROI is (revenue - ad_cost) / ad_cost and includes advertising cost only. Search has higher advertising efficiency; Social has higher revenue. These four rows validate calculations; business decisions require a larger sample and complete costs. Report zero-cost groups separately because this ROI formula would divide by zero.
The captured run was checked against the answer, downloaded CSV, and chart. The CSV has two channel summaries; the chart bars are 1750 and 2600. Planning steps and wording may vary, so verify the calculations and artifacts. Save and publish the configuration, then repeat the test in a new conversation.
4.5 Business Value
Keep the input, metric definitions, and independently calculated expected values as a regression sample. Repeat it after model, prompt, or execution-image changes to check file handling, calculations, and usable artifacts.
Last updated
Case 3: Workflow — Content Review and Automatic Rewriting
Import a runnable example and verify classification, rewriting, rejection, and human confirmation.
Build a Chat Agent
Configure models, system instructions, knowledge bases, tool calls, interactive features, and workflow conversion in a Chat Agent.