
Inspect conversation logs and execution details
Trace user feedback to retrieval, node inputs and outputs, and runtime errors.
The Conversation Logs tab (/app/detail?appId=<id>¤tTab=logs) in App details provides Data board (with a PRO badge) and Log details sub-tabs to monitor live traffic, AI points consumption, user feedback, and node-by-node execution traces.
Data Board
Switch to the Data board sub-tab and filter by source channel, date range, and aggregation interval (day, week, month, or quarter) across three dashboard sections:
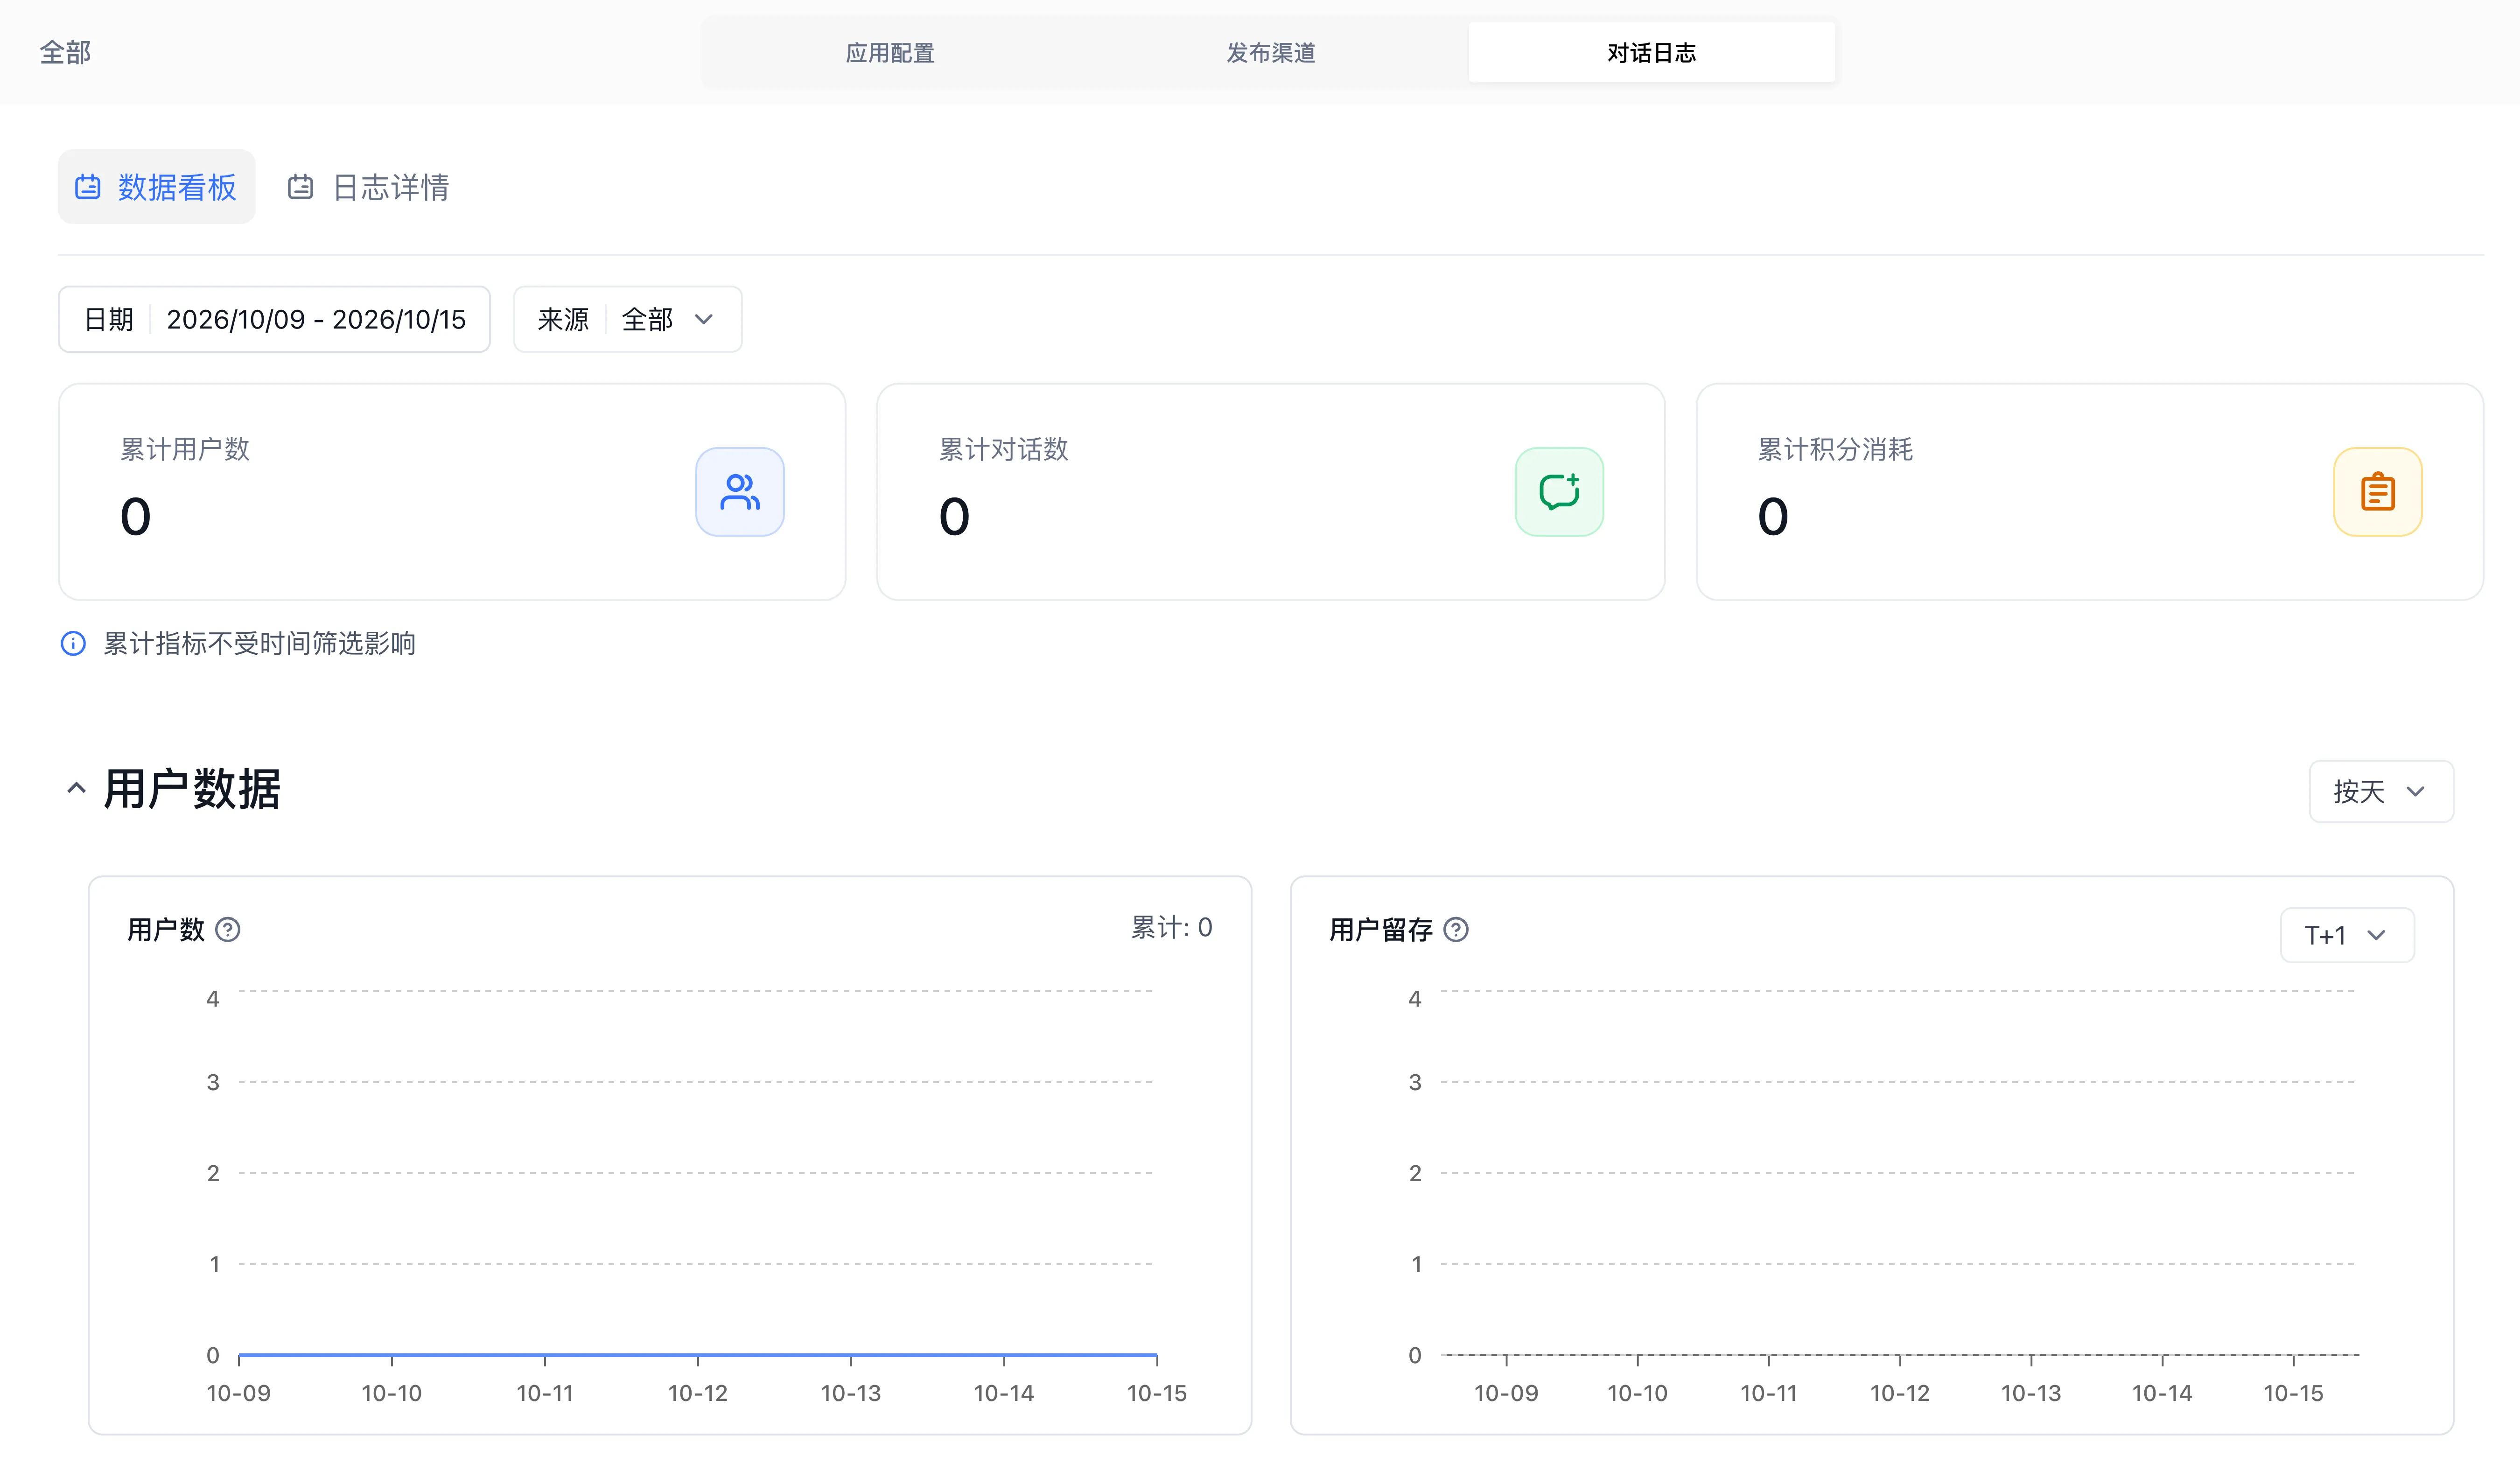
| Metric Category | Key Indicators | Operational Use |
|---|---|---|
| User data | Active user trends, new user trends, retained users, cumulative users, plus points consumed, channel users, and token consumption trends | Evaluate user growth, retention, and activity across channels |
| Chat data | Number of conversations, number of sessions, chat error rate (with total errors), and average points consumption per session | Detect error spikes caused by upstream API timeouts or model rate limits, and track cost per session |
| App performance | User feedback (good/bad trends) and average run time | Track latency and user satisfaction |
Filter, Customize Columns, and Export Logs
In the Log details view, narrow down target conversations using the filter bar:
- Multi-dimensional filters: Filter by Source channel (Online debugging, Online Use, External Link Call, API Call, Scheduled run, Lark, Official Account, WeChat Work, WeChat, MCP call), Date range, Title or Session ID, Feedback status (All Records, Has Feedback, Has Good Feedback, Has Bad Feedback, and the Unread Only checkbox), and Errors only.
- Customizable columns: Click the column settings icon to toggle session title, source, user, message count, feedback badges, custom feedback, error count, client IP, and published version name.
- Export to CSV: Click Export and confirm the matched conversation count (up to 100 messages per conversation) to download a CSV for offline review or Agent Evaluation dataset preparation.
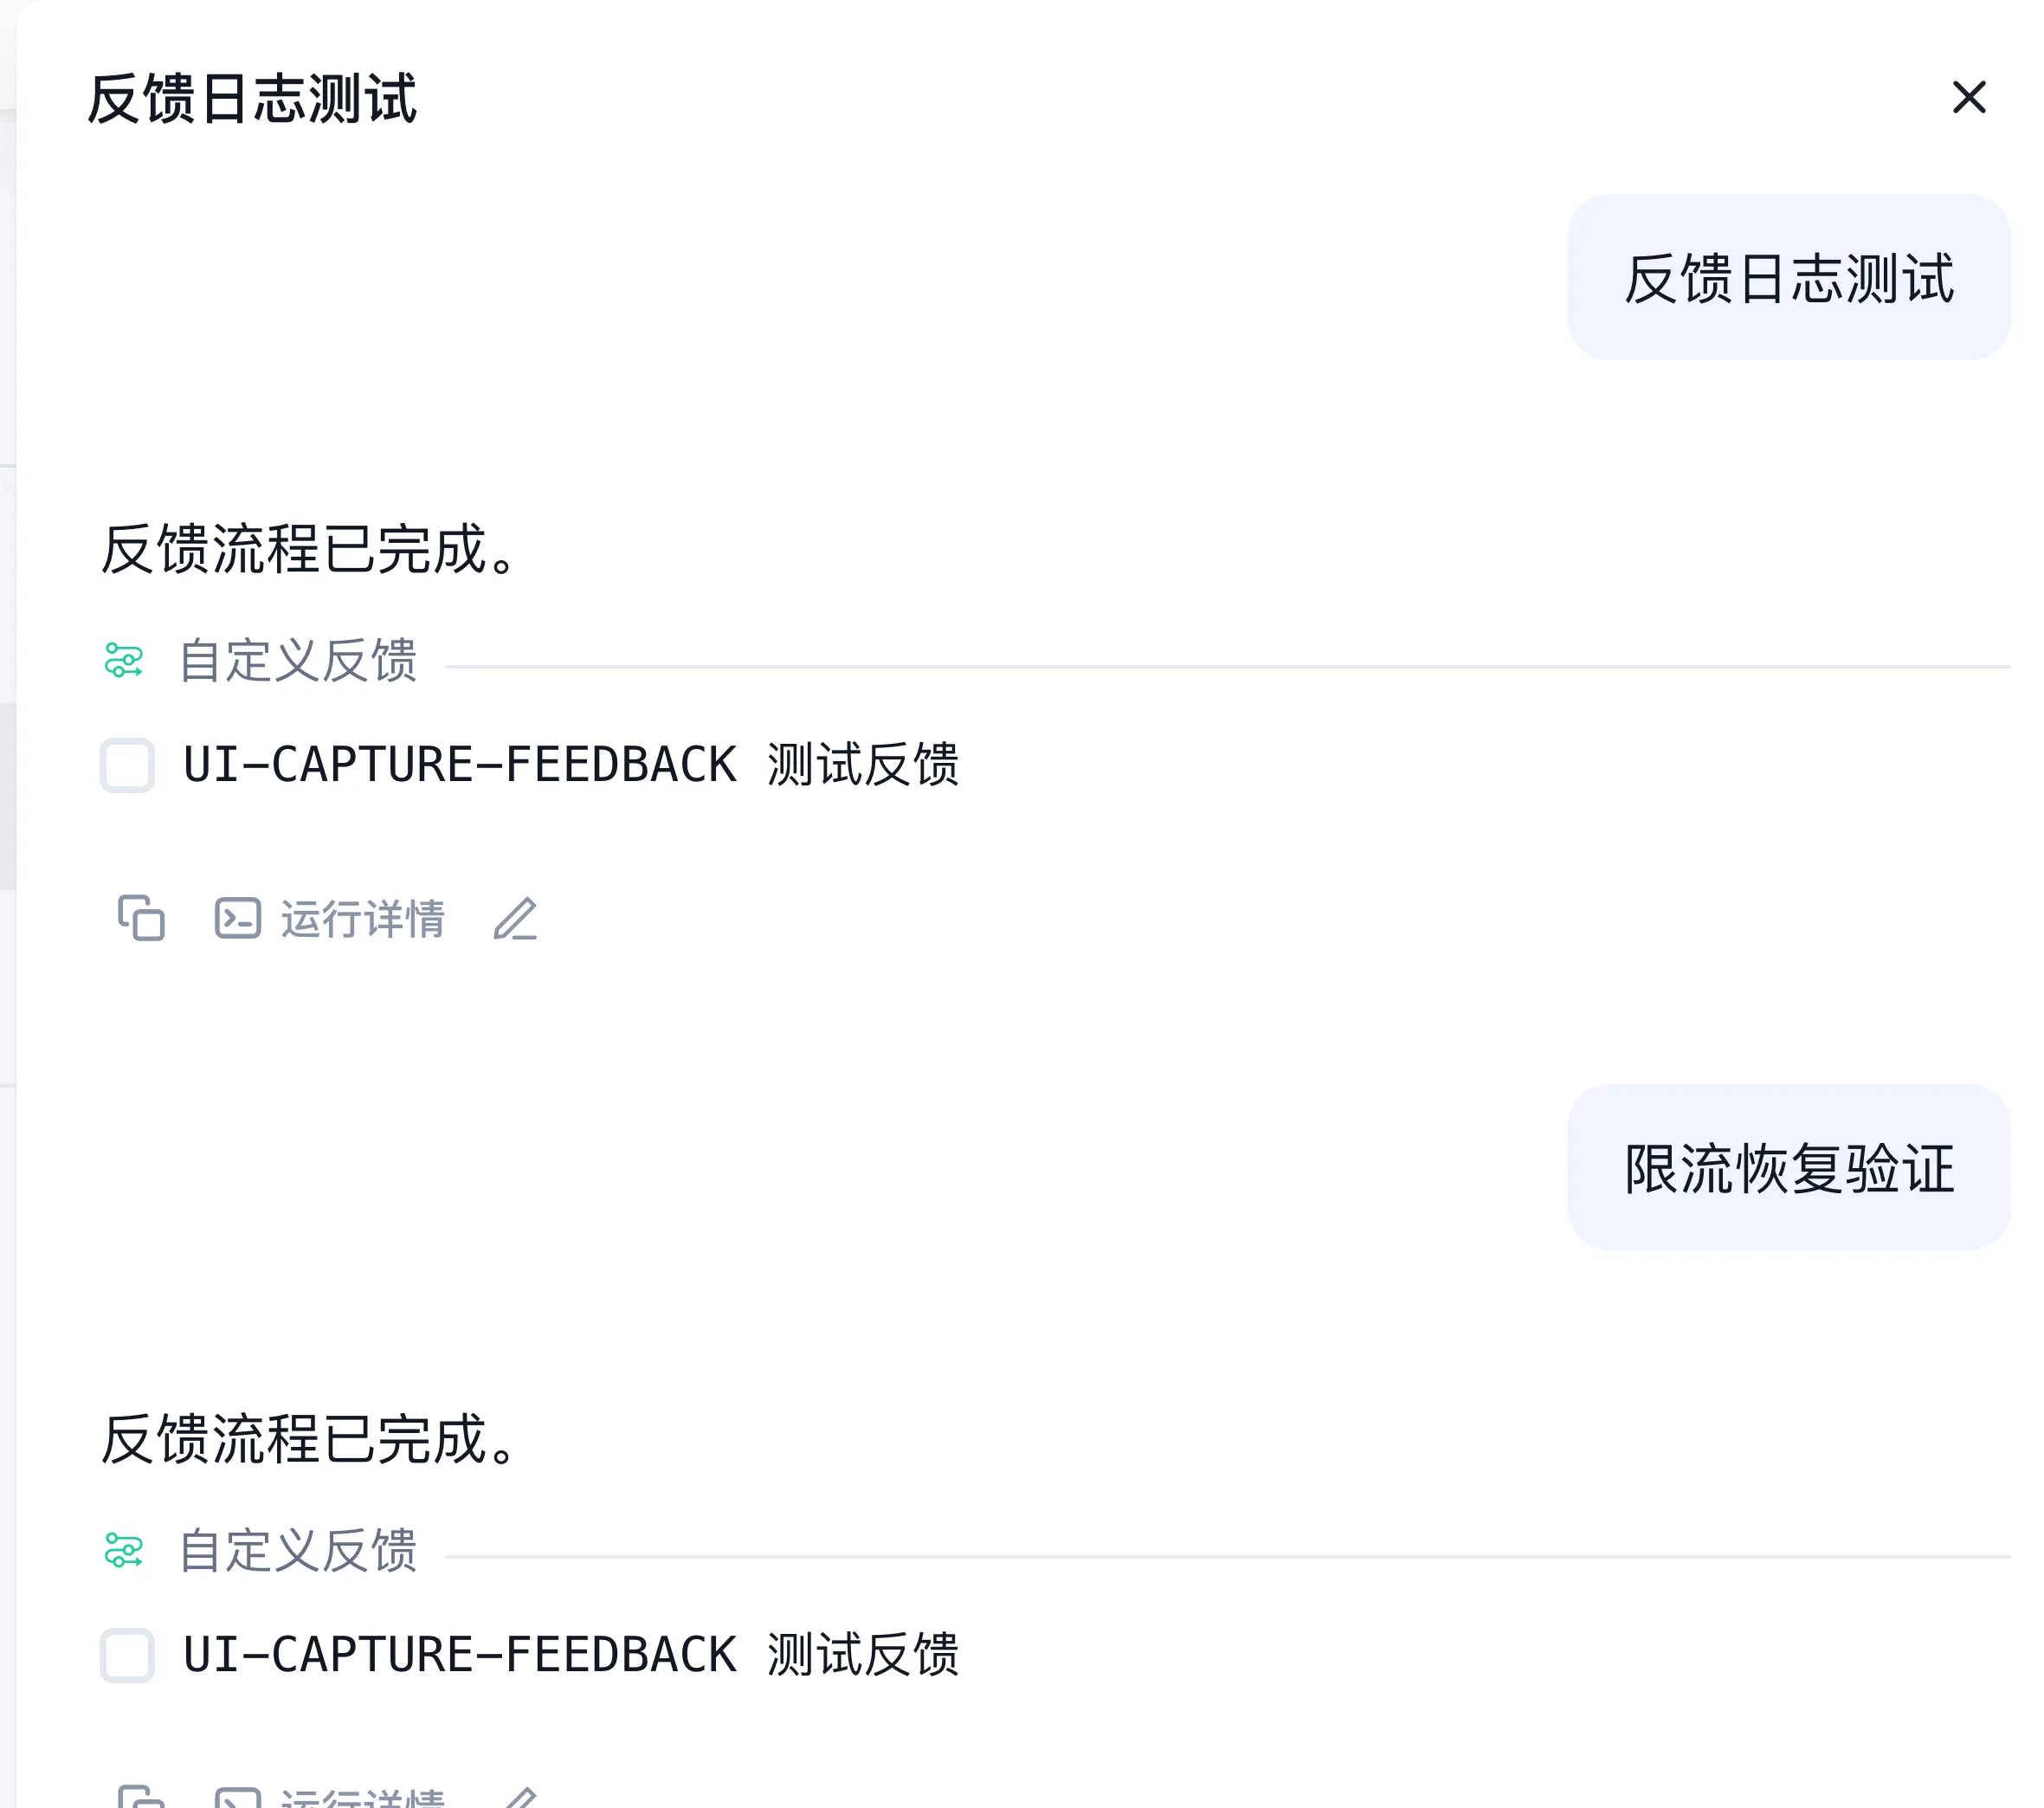
Investigate one problem
- Record time, application, access channel, question, and expected answer, removing personal information and credentials.
- Locate the conversation and inspect the original input and reply.
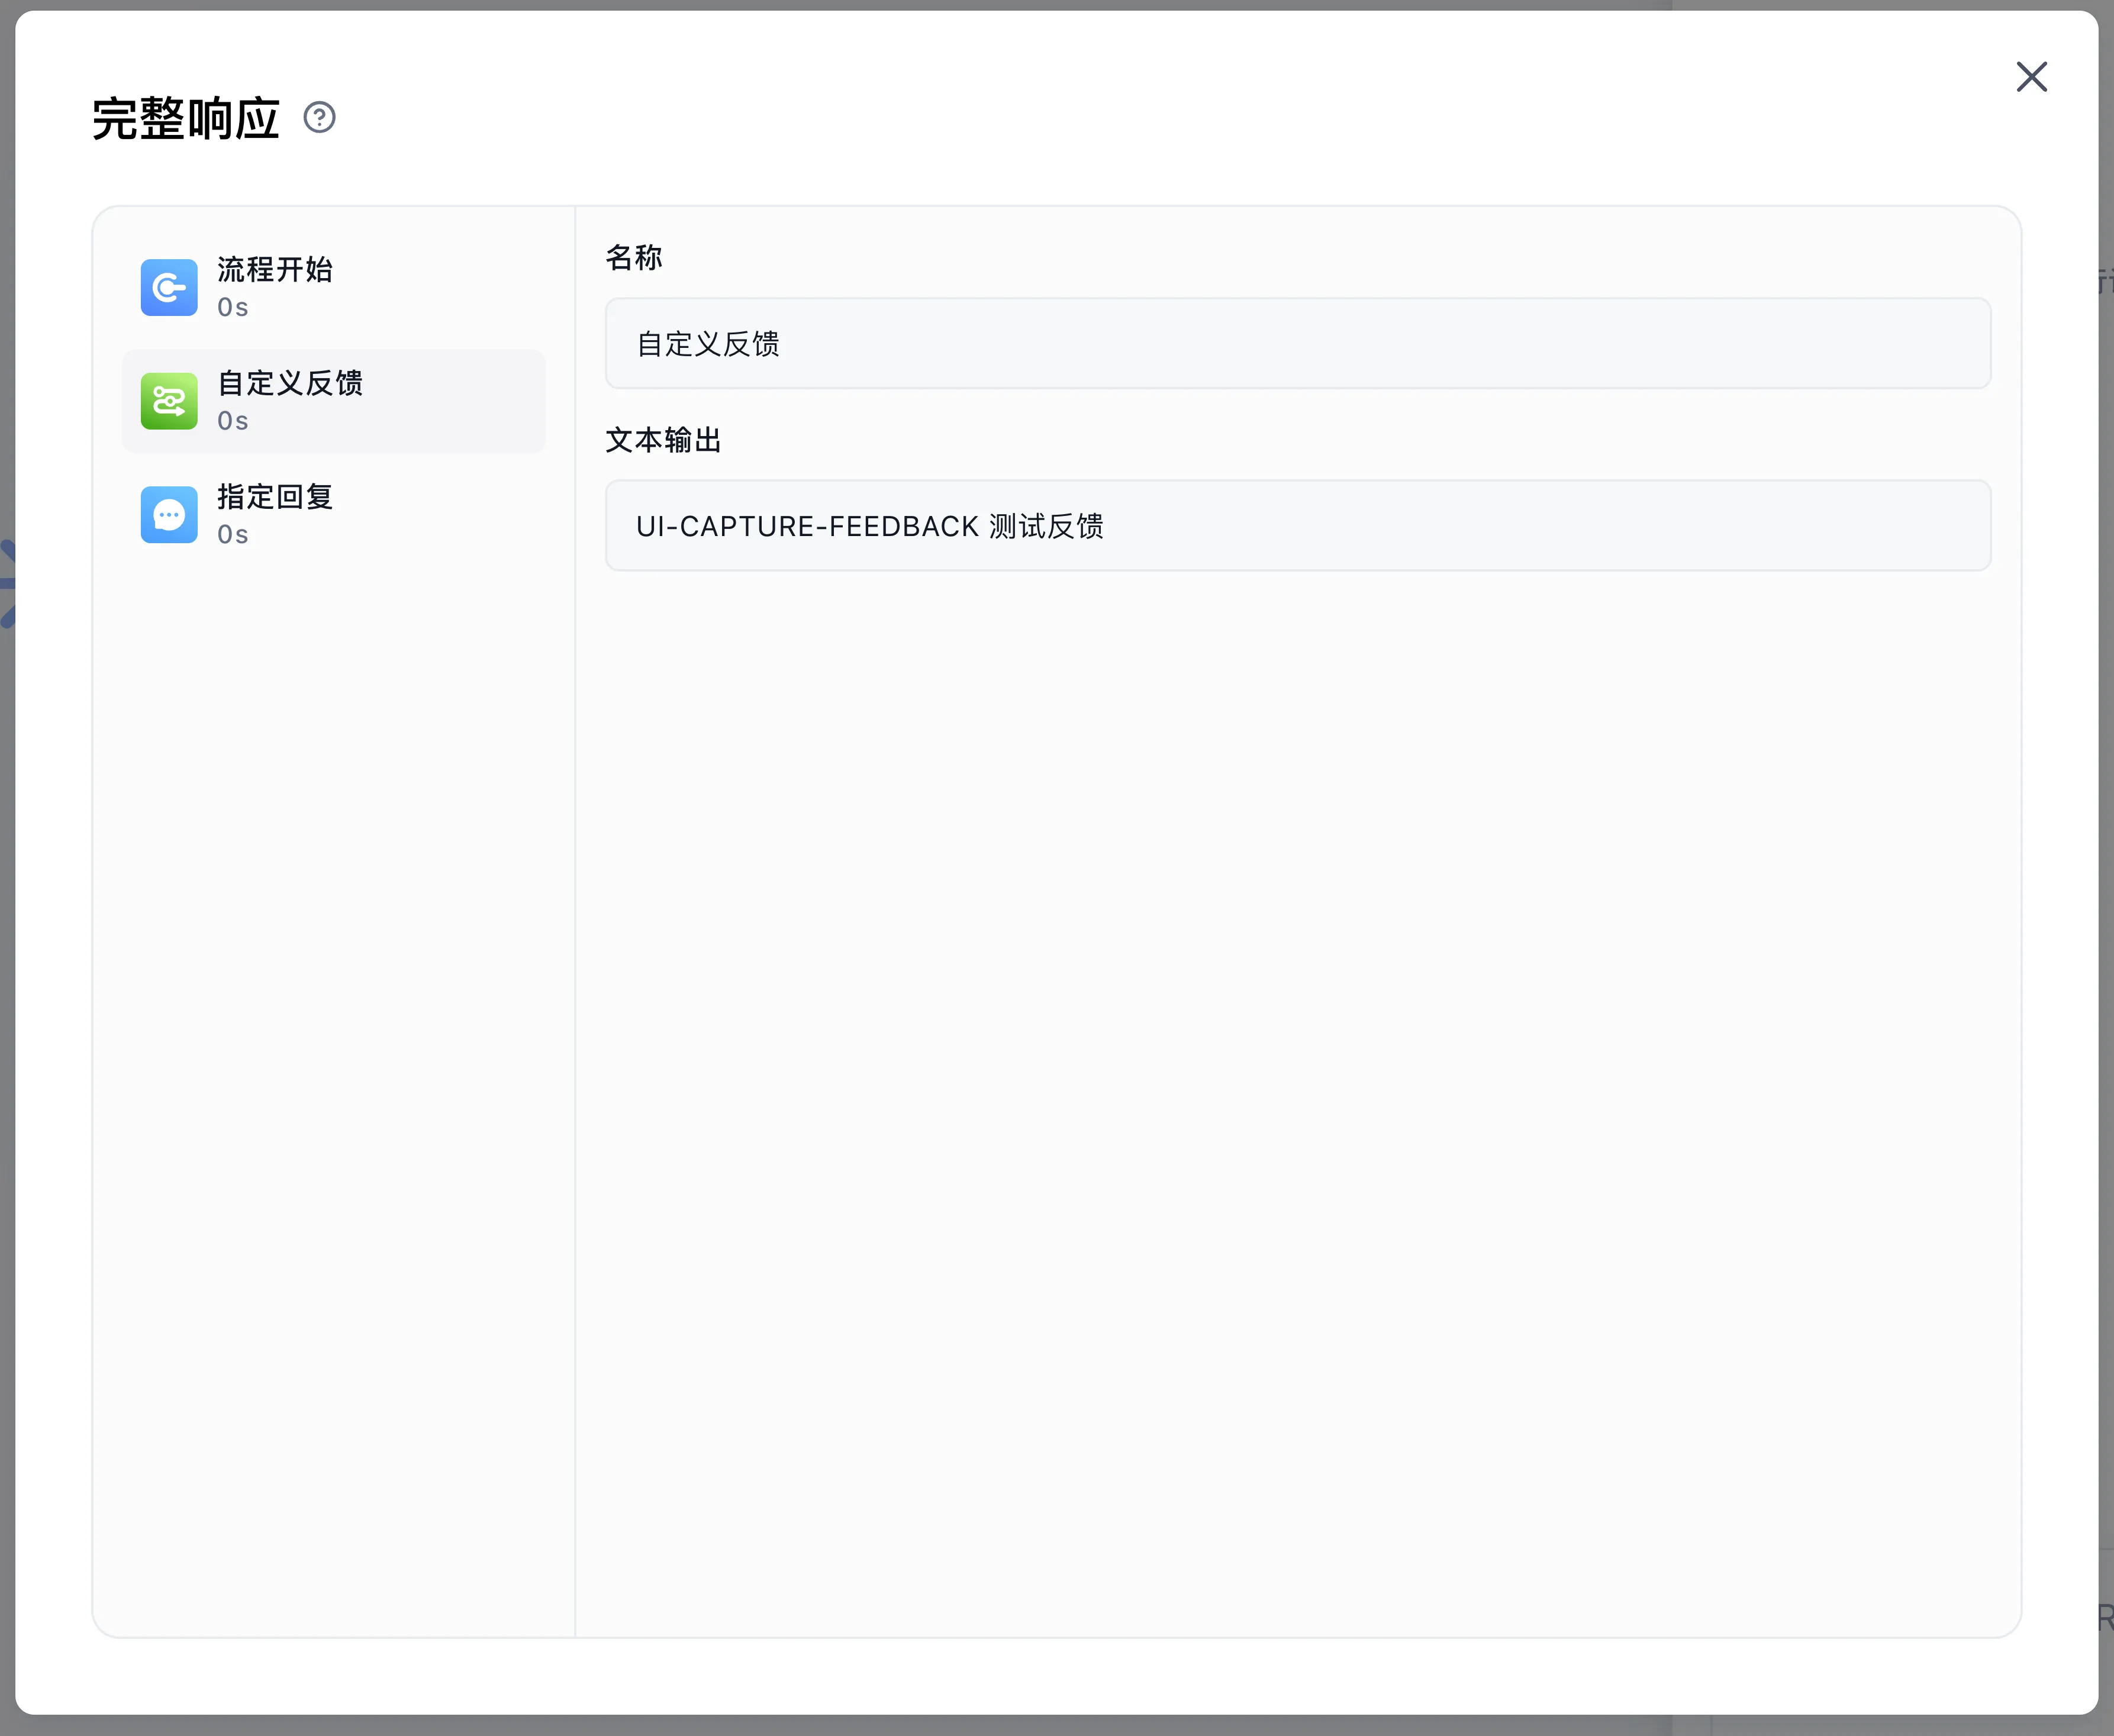
- Expand execution details and follow node inputs, tool calls, retrieved material, model output, and errors in execution order.
- Debug the same input in the editor and record differences between the draft and published version.
- Change the configuration closest to the cause, verify, publish, and repeat through actual access.
| Observation | Next check |
|---|---|
| Missing retrieved material | Processing status, retrieval scope, and parameters |
| Tool call failure | Tool input, authentication, network, and error response |
| Facts differ from expectations | Sources, model input, and instructions |
| Difference occurs only in old conversations | Message history, variables, interaction state; verify in a new conversation |
Feedback helps collect cases to investigate. Before using evaluation, prepare a fixed set of questions with expected results and confirm the environment's permissions and capabilities.
Last updated